임시지진관측망 자료를 활용한 2023년 규모 3.5 장수지진의 여진 분포 및 단층 구조 분석

초록
2023년 7월 29일 전라북도 장수군 북쪽 17 km 지역에서 규모 3.5 지진이 발생하였다. 본 연구에서는 이 지진 이후의 여진 활동을 정밀하게 분석하고, 해당 지역의 여진 분포와 관련 단층 구조를 파악하기 위해 상시지진관측망 자료와 진앙 인근에 설치·운영된 임시지진관측망 자료를 함께 활용하였다. 2023년 7월 29일부터 8월 23일까지 약 26일간의 연속파형 자료를 분석한 결과, 총 153회의 지진을 검출하였다. 이 중 4개소 이상의 관측소에서 기록되고 파형상관계수 기준을 만족한 지진에 대해서는 진폭비 기반의 상대 규모를 산정하고, 131회의 지진에 대해 초기 위치를 결정하였다. 이후 이중차분법으로 100회의 지진에 대한 상대 진원 위치를 재결정하였다. 위치 재결정된 지진은 주로 3–5 km 깊이에 집중되며, 북북동-남남서 및 동북동-서남서 방향의 두 선형 진원 배열을 이룬다. 이들 선형 배열의 방향성은 P파 초동 극성 자료로 산정한 본진 및 상대규모(Mrel) 0.64 여진의 단층면해에서 나타나는 주향과 대체로 일치하며, 연구 지역의 기존 지질 구조 방향과도 유사하다. 계층적 군집 분석 결과, 분석 기간 동안 주된 여진 발생 영역은 두 선형 배열 사이에서 시간에 따라 달라졌다. 이는 장수지진의 여진 활동이 단일 단층면에 한정되기보다, 서로 다른 주향을 갖는 인접한 단층 분절 또는 복합 단층계에서 발생했을 가능성을 시사한다. 또한 본 연구에서 제시한 정밀 여진 분포와 단층 구조 해석은 향후 한반도 내륙 중소규모 지진의 여진 감시와 지하 단층 모델 구축을 위한 기초 자료로 활용될 수 있다.
Abstract
On 29 July 2023, an ML 3.5 earthquake occurred in the Jangsu area. This study investigates the aftershock activity and characterizes the aftershock distribution and associated fault structures using data from permanent seismic stations together with a temporary seismic array deployed near the epicenter. During the analysis period from 29 July to 23 August 2023 (approximately 26 days), a total of 153 events were detected from continuous waveform data. Relative magnitudes (Mrel) were estimated using amplitude ratios for events recorded at four or more stations with sufficient waveform similarity. Initial locations were determined for 131 earthquakes, after which 100 events were relocated using the double–difference method. The relocated earthquakes are mainly distributed at depths of 3–5 km and form two linear trends striking NNE-SSW and ENE-WSW. The orientations of these linear trends are generally consistent with the nodal-plane strikes inferred from P-wave first-motion focal mechanisms for the mainshock and an Mrel 0.64 aftershock and are comparable to pre-existing geological structures in the study area. Hierarchical clustering analysis reveals that the dominant aftershock activity shifted temporally between the two structures during the analysis period. This suggests that the aftershocks were not confined to a single fault plane but likely occurred within adjacent fault segments or a complex fault system with differing orientations. This study provides high-resolution constraints on aftershock distribution and fault structure based on a temporary seismic array and contributes to aftershock monitoring and subsurface fault modeling for moderate intraplate earthquakes in the Korean Peninsula.
Keywords:
Jangsu earthquake, temporary seismic array, hypocenter relocation, hierarchical clustering analysis, focal mechanism키워드:
장수지진, 임시지진관측망, 진원 위치 재결정, 계층적 군집 분석, 단층면해1. 서 론
2023년 7월 29일 전라북도 장수군 북쪽 17 km 지역(위도: 35.80°N, 경도: 127.53°E)에서 규모 3.5의 장수지진이 깊이 6 km에서 발생하였다(그림 1). 본진 발생 약 33분 후에는 본진 진앙 인근에서 ML 1.3 여진이 발표되었다(KMA, 2023). 계기진도는 전북에서 최대 V로 측정되었으며, 경남, 충남, 충북에서는 III, 경북, 광주, 대전, 그리고 전남 등에서는 II로 기록되었다(KMA, 2023). 지진으로 인한 유감신고와 건물 피해는 각각 52건과 7건이 보고되었다(MOIS, 2023). 장수 지역은 역사적으로도 지진 기록이 존재하는 지역이다. 1422년에는 ‘전라도의 장수(長水), 금산(錦山), 남원(南原), 진안(鎭安), 진산(珍山), 용담(龍潭)에 지진이 있었다’는 역사지진 기록이 존재하며, 해당 지진 발생 추정 위치(위도: 35.8°N, 경도: 127.5°E)는 장수지진 발생 위치와 거의 일치한다. 이 지진은 추정진도 V 및 강진반경 37.6 km로 발생한 것으로 평가되었다(Lee and Yang, 2006; KMA, 2012). 이러한 역사적 기록과 더불어 계기지진 관측이 시작된 1978년 이후 현재까지, 장수지진 진앙 기준 반경 1 km 이내에서는 최소 규모 1 이상의 지진 15회가 보고되었다(KMA, 2025). 이들 지진은 모두 2020년 이후에 보고되었지만, 이를 2020년 이전 지진 활동의 부재나 최근 재활성화로 단정하기는 어렵다. 과거에는 진앙 주변의 상시관측망 밀도가 현재보다 낮았기 때문에, 작은 규모의 지진을 안정적으로 검출하는 데 한계가 있었을 가능성이 크다(Kim, 2019).
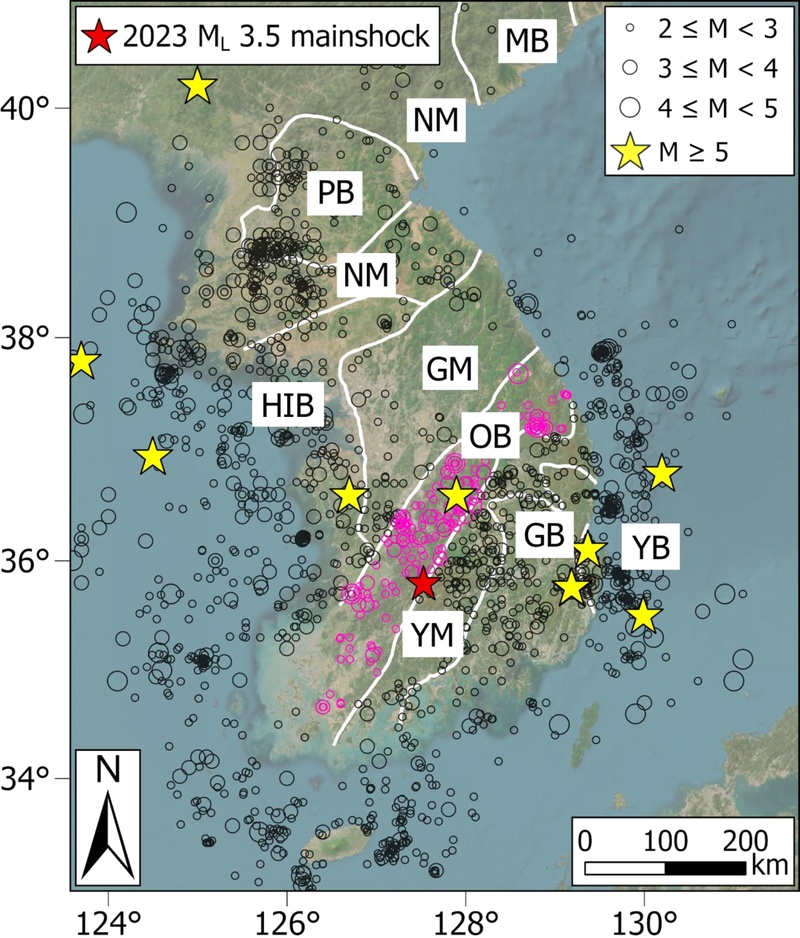
Tectonic setting of the Korean Peninsula and distribution of instrumental earthquakes. White solid lines indicate the approximate boundaries of major tectonic provinces of the Korean Peninsula, including the Macheollyeong Belt (MB), Pyeongnam Basin (PB), Nangrim Massif (NM), Hongseong-Imjingang Belt (HIB), Gyeonggi Massif (GM), Okcheon Fold Belt (OB), Youngnam Massif (YM), Gyeongsang Basin (GB), and Yeonil Basin (YB). Instrumental earthquakes during 1978-2025 are shown by circles (2.0 ≤ ML < 5.0; scaled by magnitude) and yellow stars (ML ≥ 5.0) (KMA, 2025). Magenta circles indicate earthquakes that occurred within the Okcheon Fold Belt. The red star marks the 2023 ML 3.5 Jangsu earthquake.
한반도는 판 내부에 위치한 안정 대륙 지역(Stable Continental Region)에 속하여, 일본과 대만 등 판 경계 지역에 비해 상대적으로 낮은 지진 활동성을 보인다(Johnston, 1996; Schulte and Mooney, 2005). 지체구조적으로는 낭림 육괴(Nangrim massif), 경기 육괴(Gyeonggi massif), 영남 육괴(Youngnam massif)와 이를 구분하는 홍성-임진강대(Hongseong-Imjingang belt)와 옥천대(Okcheon fold belt)로 크게 구분되며, 해당 지역의 암석 특성에 따라 다양한 분지(연일분지, 경상분지 등)와 화산지대 등으로 구성된다(그림 1; Chough et al., 2000). 옥천대의 지구조적 형성과정에 대해서는 다양한 해석이 제시되어 왔으며, 여러 선행 연구에서는 고생대 열곡의 형성 및 이후의 분지 역전 모델(Cluzel et al., 1991)과 후기 페름기–중기 트라이아스기 동안 남중국 육괴(South China craton)와 북중국 육괴(North China craton)의 수렴 및 충돌(Yin and Nie, 1993; Chough et al., 2000)의 가능성이 논의되어 왔다. 또한 이러한 대륙 충돌 과정과 연계된 주향이동단층의 재변형 굴곡(restraining bend)에 의한 압축 변형으로 옥천대의 구조적 진화를 설명하려는 해석이 제안되고 있다(Kim et al., 2018a). 옥천대 전역에서는 2007년 규모 4.8 오대산지진, 2019년 규모 3.9 상주지진, 2022년 규모 4.1 괴산지진 등 규모 3 이상 지진이 간헐적으로 발생하고 있다(Kim and Park, 2010; Kim, W.-Y. et al., 2023; Lee et al., 2025). 아울러 본 연구 지역을 중심으로 반경 30 km 이내에서는 지난 47년간 총 193회의 지진이 보고되었다(KMA, 2025).
2016년 규모 5.8 경주지진과 2017년 규모 5.4 포항지진이 발생한 이후, 지진 관측 및 조기 경보를 목적으로 상시관측망의 밀도가 증가함과 동시에 한반도의 활성단층 및 지진활동 연구가 확대되었다. 그러나 상시관측망은 관측소 간 간격이 수십 km 이상으로 비교적 넓게 분포하고 있어, 진앙 인근에서 작은 규모로 발생하는 여진의 고해상도 검출과 정밀한 진원 위치 결정에는 여전히 한계가 있다. 특히 내륙 지역에서는 근거리 관측 자료의 부족과 일부 제한된 방위각 분포로 인해 여진 활동과 단층 구조 간의 공간적 관계를 정밀하게 규명하는 데 한계가 있다. 또한 본 연구 지역의 단층에 대한 선행연구는 거의 보고된 바가 없으며, 지진 활동 및 지표 단층 조사에 대한 정보는 부족한 실정이다.
본 연구에서는 장수지진 이후의 여진 활동과 관련 단층 구조를 정밀하게 파악하기 위해 진앙 인근에 임시지진관측망을 설치·운영하였다. 임시지진관측망과 상시지진관측망 자료를 함께 활용하여 여진을 검출하고 상대규모를 산정하였으며, 초기 진원 위치 결정과 이중차분법을 이용한 위치 재결정을 통해 여진 분포의 정밀도를 향상시켰다. 또한 파형 유사성에 기반한 계층적 군집 분석을 수행하여 여진 분포의 구조적 특징을 정량적으로 구분하고, 단층면해 결과와 기존 지질 구조를 함께 고려하여 장수지진 발생 지역의 단층 기하와 운동 특성을 해석하였다.
2. 연구자료
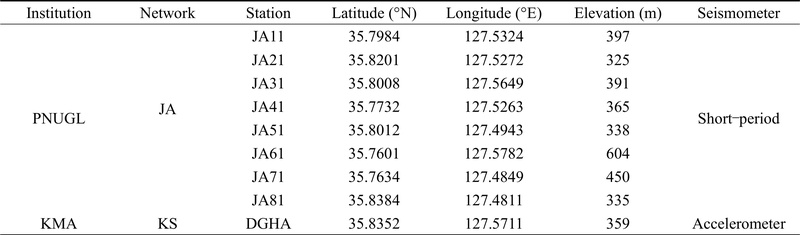
장수지진 이후 발생한 여진을 효율적으로 관측하기 위해, 본 연구에서는 진앙 반경 50 km 이내에 위치한 기상청 상시관측소 18개소와 한국지질자원연구원 상시관측소 1개소의 자료에 더하여, 8개소로 구성된 임시지진관측망 자료를 함께 활용하였다(그림 2). 진앙에 가장 인접한 상시관측소는 기상청에서 운영하는 동향(DGHA) 관측소로, 진앙으로부터 약 6 km 거리에 위치한 가속도계 관측소이다(그림 2b). 그 외 상시관측소는 대부분 진앙으로부터 20 km 이상 떨어져 있으며, 이 중 한국지질자원연구원에서 운영하는 김천(KMC) 관측소는 진앙으로부터 약 46 km 거리에 위치한다(그림 2a). 상시관측망은 장기간 관측을 실시하여 양질의 자료를 제공하나, 진앙과의 거리 및 방위각 분포(azimuthal distribution)에 따라 여진 검출, 위상 발췌(phase picking), 진원 위치결정의 정확도 등에 한계가 있을 수 있다. 이에 비해, 진앙 인근에 추가로 단기간 구축되는 임시지진관측망은 근거리 고품질 파형 확보를 통해 소규모 여진 검출 및 진원 위치결정의 정밀도를 향상시키는 데 효과적이며, 국내외에서 여진 및 군발지진 연구에 활용되어 왔다(Kim et al., 2018b, 2020; Liu et al., 2023; Lim et al., 2024; Zulfakriza et al., 2024).
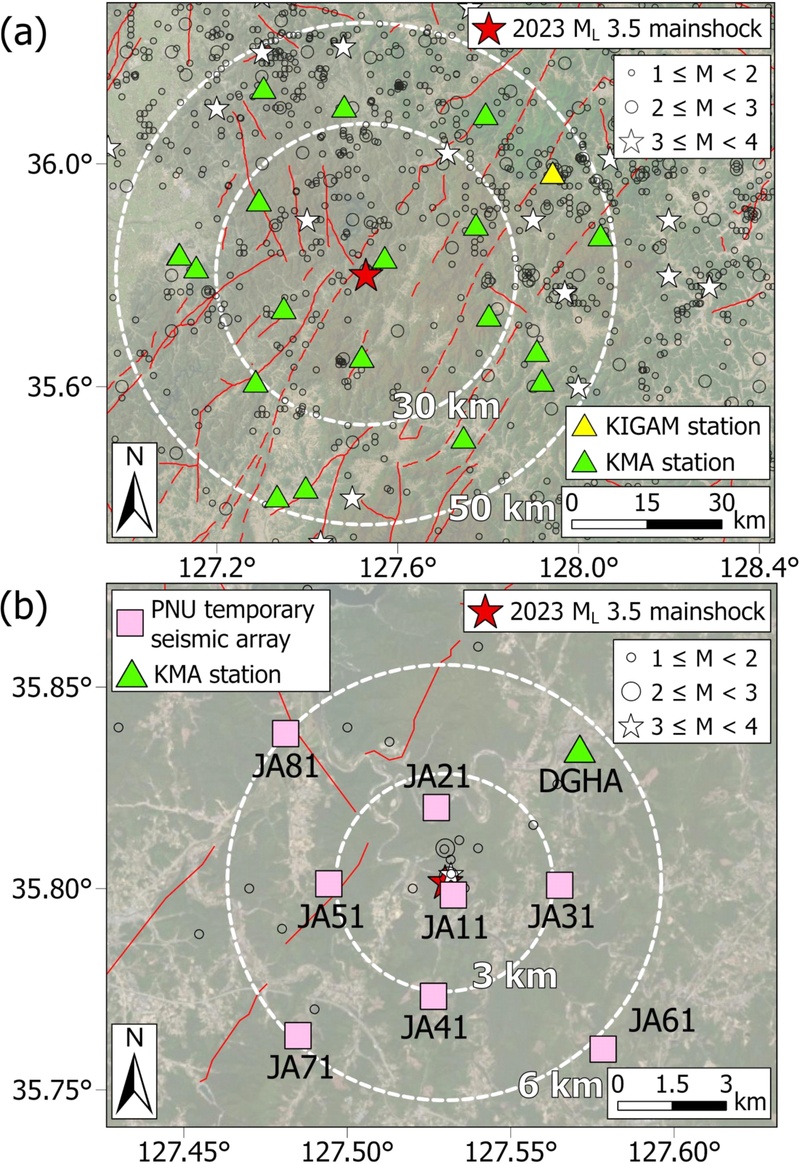
Distribution of seismic stations, instrumental earthquakes, and mapped surface faults near the Jangsu earthquake. Surface faults from KIGAM (2020) are shown by red lines. (a) Earthquakes during 1978-2025 are shown by black circles (1.0 ≤ ML < 3.0) and white stars (3.0 ≤ ML < 4.0). White dashed circles indicate 30 and 50 km radii centered on the Jangsu earthquake epicenter. The 50 km circle defines the station-selection area, whereas the 30 km circle denotes the area used to summarize local seismicity, where 193 earthquakes, including two events with ML ≥ 3.0, were cataloged. (b) PNUGL temporary seismic array (pink squares) and permanent stations (green triangles). White dashed circles indicate 3 and 6 km radii centered on the Jangsu earthquake epicenter.
규모가 작은 지진일수록 고주파 성분이 우세해지며 지진파 전파에 따른 감쇠가 크고, 방사되는 에너지가 작아 진원 인근 관측소에서만 기록되므로, 진앙 인근 소규모 여진 검출 및 위치 결정을 목적으로 하는 본 연구에서는 임시지진관측망을 단주기 지진계 8개소로 구성하였다. 사용한 장비는 SmartSolo사의 센서–기록계 일체형 모듈식 3성분 단주기 지진계(IGU-16HR)로, 기록계 해상도는 32-bit이며 76.7 V/m/s의 센서 민감도를 보인다(SmartSolo, 2022). 파형 자료의 250 sps (sample per second)의 표본화율(sampling rate)로 기록하였으며, 임시지진관측망의 배열은 기상청 상시관측소 동향(DGHA)의 위치와 본진의 진원을 고려하여 설계하였다. 장수지진 발생 약 5시간 후부터 설치를 시작하였으며, 약 4시간에 걸쳐 진앙 인근에 1개소(JA11), 진앙 반경 약 3 km 부근에 4개소(JA21–JA51), 반경 약 6 km 부근에 3개소(JA61–JA81)를 설치하였다(표 1; 그림 2b). 관측소는 원형에 가까운 배열로 설치하여 방위각 불균형을 최소화하고, 다양한 방향에서 입사하는 지진파의 기록을 확보하고자 하였다. 또한 임시지진관측망의 설치는 접근성 및 운영 여건을 고려하여 수행되었다. 관측 장비는 대부분 posthole 방식으로 설치하였으며, 주변 잡음의 영향을 줄이4조유성ㆍ김광희ㆍ강희철기 위해 지표면에서 약 30 cm 깊이로 매립하였다. 주로 산지, 마을 외곽 공터, 산길 주변 등 비교적 인위적 잡음이 적은 환경을 선정하였으며, 획득한 연속파형자료에서도 전반적으로 양호한 신호대잡음비(SNR; Signal-to-Noise Ratio)가 확보되었다. 구축된 임시지진관측망은 2023년 7월 29일부터 8월 23일까지 총 26일간 데이터 공백 없이 운영되었으며, 해당 기간 동안 장수지진의 여진으로 판단되는 다수의 이벤트 파형이 기록되었음을 확인하였다(그림 3).

Temporary seismic stations and a permanent station for monitoring events. PNUGL: Pusan National University Geophysics Laboratory, KMA: Korea Meteorological Administration.
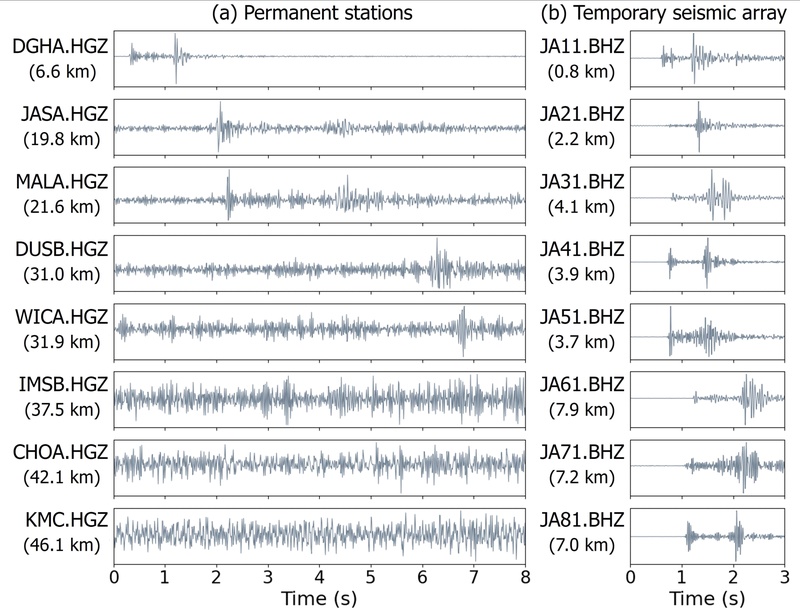
Vertical–component waveforms of a detected aftershock recorded at (a) permanent stations and (b) the PNUGL temporary seismic array. The event occurred on 6 August 2023 at 20:27:34.68 (Mrel 0.31). All waveforms are normalized and bandpass filtered at 5–40 Hz. Epicentral distances are indicated below the station names.
3. 연구방법
3.1. 배경잡음 분석
배경잡음 수준은 관측소에서 기록되는 지진자료의 SNR을 결정하는 주요 요인 중 하나이며, 진폭이 작은 소규모 지진의 경우 배경잡음 수준에 따라 지진 검출 능력이 크게 좌우되는 것으로 알려져 있다(Given, 1990; McNamara and Buland, 2004; Sheen and Shin, 2010). 이에 본 연구에서는 임시지진관측망의 관측 역량을 확인하기 위해 관측소의 수직 및 수평 성분을 포함한 3성분 배경잡음 수준을 분석하였다. 배경잡음 분석에는 관측소별 잡음의 통계적 특성을 파악하는 데 표준적으로 사용되는 확률적 파워 스펙트럼 밀도(PPSD; probabilistic power spectral density) 방법을 사용하였다(McNamara and Buland, 2004). 해당 방법은 Krischer et al. (2015)의 Python 기반 지진자료 처리 소프트웨어인 ObsPy에 구현된 PPSD 모듈을 이용하였다.
연속파형자료를 50% 중첩하여 1시간(3600초) 단위로 분할한 뒤 계기응답을 제거하였다. 각 1시간 자료는 약 600초 길이의 소분절로 나누고, 소분절 간 75% 중첩(150초 이동 간격)을 적용하여 총 13개의 소분절을 생성하였다. 각 소분절로부터 파워스펙트럼밀도(PSD; power spectral density)를 계산하였으며, 분석 기간 동안 계산된 모든 PSD는 확률분포 형태로 누적하여 PPSD로 표현하였다. 산정된 속도 스펙트럼을 가속도 스펙트럼으로 변환한 뒤, Peterson (1993)이 제시한 전 세계 지진관측소의 장기간 배경잡음 자료에 기반한 경험적 상한과 하한 모델인 New High Noise Model (NHNM)과 New Low Noise Model (NLNM)을 기준으로 잡음 수준을 평가하였다. 본 연구에서는 여진 검출에 활용된 임시지진관측망 자료를 대상으로 배경잡음 분석을 수행하였다. 분석 기간은 임시지진관측망 운영 기간과 동일하다.
3.2. 지진 검출 및 규모 산정
본 연구에서는 Passcal Quick Look (PQL II) 프로그램을 이용하여 임시지진관측소 8개소에 기록된 연속파형자료를 시각화한 후, 진폭 변화 및 P파와 S파의 위상 특성을 기준으로 지진을 수동으로 검출하였다(PASSCAL, 2017). 지진 검출은 임시지진관측망을 운영한 2023년 7월 29일부터 8월 23일까지 수행하였다(표 1; 그림 2b). 검출한 지진 중 최소 4개소 이상의 관측소에서 파형이 기록된 지진만을 연구에 활용하였다. 각 지진의 규모는 식 1을 활용하여 상대적으로 산정하였다.
| (1) |
Munknown은 구하고자 하는 검출한 지진의 상대 규모, Mknown은 기상청 발표 지진의 규모, Aunknown은 검출한 지진의 진폭, Aknown은 기상청 발표 지진의 진폭을 의미한다. c는 진폭–규모 스케일링 상수(amplitude–magnitude scaling coefficient)로 두 지진쌍의 진폭비와 규모차 사이의 경험적 관계를 정의하며, 본 연구에서는 기존 상대 규모 산정 연구에 따라 진폭–규모 스케일링 상수 c를 1로 설정하였다(Schaff and Richards, 2014; Shelly et al., 2016). 이는 규모 범위가 다양한 충분한 지진이 확보되지 않은 조건에서 일관된 상대 규모 체계를 유지하기 위함이다.
상대 규모 산정을 위한 관측소로는 연구 지역과 가장 인접한 상시관측소 DGHA와 임시지진관측망에 포함된 모든 관측소를 활용하였다. 두 수평 성분 파형에 대해 5–20 Hz 대역필터(bandpass filter)를 적용하였으며, 전체 파형 구간에서 측정된 두 수평 성분 최대 진폭의 기하평균을 이용하여 상대 규모를 산정하였다. 또한 결과의 신뢰도를 확보하기 위해 파형 상관계수(WCC; waveform cross-correlation)가 0.7 이상인 지진쌍을 분석에 사용하였다. 이는 높은 상관계수를 갖는 지진쌍이 유사한 전파경로 및 소스 특성을 공유하며, 이러한 조건에서 진폭비가 규모 차이를 보다 안정적으로 반영할 수 있기 때문이다(Schaff and Richards, 2014; Gable and Huang, 2025).
상대 규모 산정은 동일 관측소에서 기록된 파형의 진폭비를 기준으로 수행하였다. 먼저 상시관측망에 기록된 지진에 대해서는 DGHA 관측소에서 측정된 진폭비를 이용하여 기준 지진 대비 상대 규모를 계산하였다. 이후 DGHA에 기록되지 않은 지진에 대해서는, DGHA에서 이미 상대 규모가 결정된 지진을 기준으로 사용하고, 임시지진관측망 각 관측소에서 동일한 절차를 적용하여 규모를 추정하였다. 최종적으로는 각 임시지진관측소에서 독립적으로 계산된 상대 규모 값들의 중간값(median)을 해당 지진의 규모로 채택하였다.
본 연구에서 산정한 상대 규모는 국지규모(ML)를 직접 재산정한 값이 아니라, 동일 관측소에서 기록된 파형의 진폭비에 기반한 상대적 크기 지표이다. 따라서 상대 규모는 지진 간 상대적인 규모 비교 및 규모 분포 분석에는 유효하나, 절대적인 ML과 동일한 물리량으로 직접 해석하는 데에는 제한이 있다. 이에 따라 본 연구에서는 기상청 계기지진의 규모는 ML로, 진폭비를 이용하여 산정한 지진의 상대 규모는 Mrel로 구분하여 표기하였다.
3.3. 진원 위치 결정 및 단층면해 계산
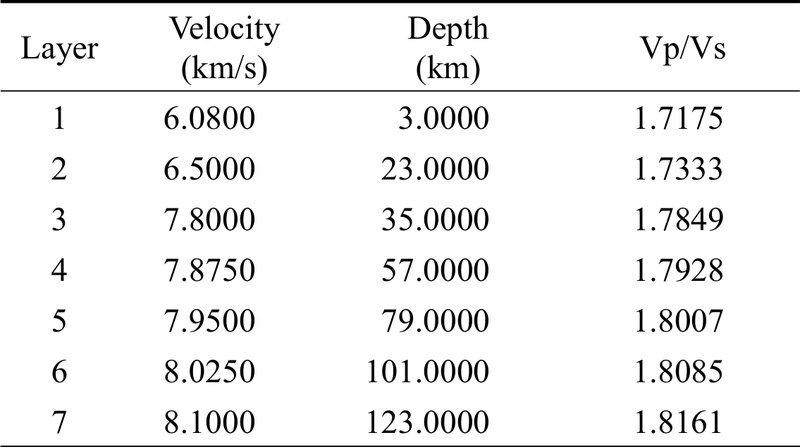
정확한 진원 위치 결정을 위해서는 해당 지역의 지각 특성을 반영한 지하 속도구조 모델의 적용이 필요하다. 일반적으로 특정 지역에 최적화된 속도모델은 전지구 속도모델을 기초로 하여 지역적인 관측 자료를 반영한다(Park, 2008; Bunaga et al., 2023). 본 연구에서는 이러한 과정을 통해 전지구 속도모델인 IASP91(Kennett and Engdahl, 1991)을 한반도 지질 특성에 맞게 제안된 속도모델을 위치 결정 전반에 활용하였다(표 2; Park, 2008). 최소 4개의 관측소에서 기록된 지진을 초기 위치 결정(Initial location)하였으며, 수동으로 위상 발췌한 P파와 S파의 도착 시간을 이용하여 선형화 역산 반복법인 Geiger’s method (Geiger, 1910, 1912)를 적용하는 HYPOELLIPSE 프로그램(Lahr, 1999)을 사용하였다. 그러나 HYPOELLIPSE는 지진파 도착 시간과 1차원 속도모델에 기반하여 진원 위치를 결정하므로, 속도모델과 실제 지하 속도 구조 간의 차이와 도착 시간 계산 과정에서 발생하는 오차가 진원 위치 정확도에 영향을 미칠 수 있다(Woo et al., 2016).
Used 1-D velocity model in this study (Park, 2008).
이러한 한계를 완화하고 지진 분포를 보다 정밀하게 파악하기 위해, 인접 지진쌍의 도착시간 차이를 이용하는 이중차분법에 기반한 HypoDD 프로그램(Waldhauser and Ellsworth, 2000)을 적용하여 진원 위치를 상대적으로 재결정하였다. 해당 기법은 진원에서 관측소까지의 공통 전파경로에 따른 속도모델에 의한 영향을 완전히 상쇄하지는 않으나, 두 지진의 도착시간 잔차(residual) 차이를 이용함으로써 단일 진원 위치 결정에 비해 속도모델에 대한 의존도를 감소시키고 지진 간 상대 위치 정밀도를 향상시킨다. 위치 재결정 과정에서는 수동으로 발췌된 P파 및 S파 도착시간 자료와 파형 상호상관을 이용하여 산정된 도착시간 차이를 사용하였다. 파형 상관계수 계산을 위해 P파와 S파에 대하여 각각 0.4초와 0.6초의 시간 창을 설정하였으며, 5–20 Hz의 대역필터를 적용하였다. 최대 시간 이동(time shift)은 0.1초 이내로 제한하였으며, 계산된 WCC 값이 0.7 이상인 지진쌍을 선별하여 진원 위치 재결정에 활용하였다.
위치 재결정된 지진 분포로부터 두 개의 서로 다른 방향성을 가지는 구조가 관찰됨에 따라, 이를 정량적인 기준으로 구분하기 위해 파형 상호상관에 기반하여 서로 유사한 파형을 가진 이벤트를 묶어 여러 개의 군집으로 분류하는 계층적 군집 분석(Hierarchical clustering analysis) 방법을 수행하였다(e.g., Son et al., 2018; Han and Kim, 2025). Son et al. (2018)에서는 계층적 군집 분석을 통해 2016년 경주에서 발생한 528회의 지진을 세 개의 주요 그룹으로 구분하였으며, 이를 통해 위치 재결정 결과의 신뢰성을 확보하고 단층면이 서로 다른 조건을 갖는 영역들로 구성되어 있음을 제시하였다. Han and Kim (2025)은 2024년 부안에서 발생한 규모 4.8 본진과 26회의 여진에 대해 계층적 군집 분석을 수행하여 지진이 북북동-남남서 및 서북서-동남동 방향의 단층이 서로 가깝게 교차하는 구조에서 발생했음을 확인하였다.
계층적 군집 분석을 위한 WCC 계산에는 본진과 대부분의 여진과 가장 인접한 JA11 관측소의 수직 성분(Z) 파형을 사용하였다. 해당 파형에 대해 전체적으로 5–40 Hz 대역필터를 적용하였으며, 시간 창은 각 지진의 P파 도착시간 0.1초 이전부터 1.4초 이후까지 총 1.5초로 설정하여 P파와 S파가 모두 포함되도록 설정하였다. 단층면해는 HASH 프로그램(Hardebeck and Shearer, 2002)을 사용해 P파 초동 자료로 계산하였고, 이후 계층적 군집 분석 방법을 사용하여 구분된 위치 재결정된 지진 분포 및 단층면해 결과를 종합적으로 비교하여 본진 및 여진의 특성을 파악하였다.
4. 결 과
4.1. 관측소 배경잡음 수준
임시지진관측망의 배경잡음 수준을 PPSD로 분석한 결과는 그림 4와 같다. 작은 규모의 지진 검출과 분석에 주로 활용되는 0.02–0.5초 주기(Withers et al., 1998; Trnkoczy et al., 2012)에서 모든 관측소는 전 기간에 걸쳐 대부분 -145 ~ -90 dB 사이의 낮은 잡음 수준을 유지하였다. 0.1초 이상의 주기에서는 모든 관측소의 잡음 분포가 NHNM과 NLNM 모델 사이에 위치함을 확인하였다(Peterson, 1993). 수직 및 수평 성분 간 배경잡음을 비교한 결과, 전반적인 잡음 수준은 성분 간에 뚜렷한 차이를 보이지 않는 것으로 나타났다. 이는 본 관측 자료가 특정 성분에 편향되지 않은 비교적 균질한 잡음 특성을 보임을 시사한다. 따라서 본 자료는 전반적인 분석에 활용 가능한 품질을 갖는 것으로 판단된다.
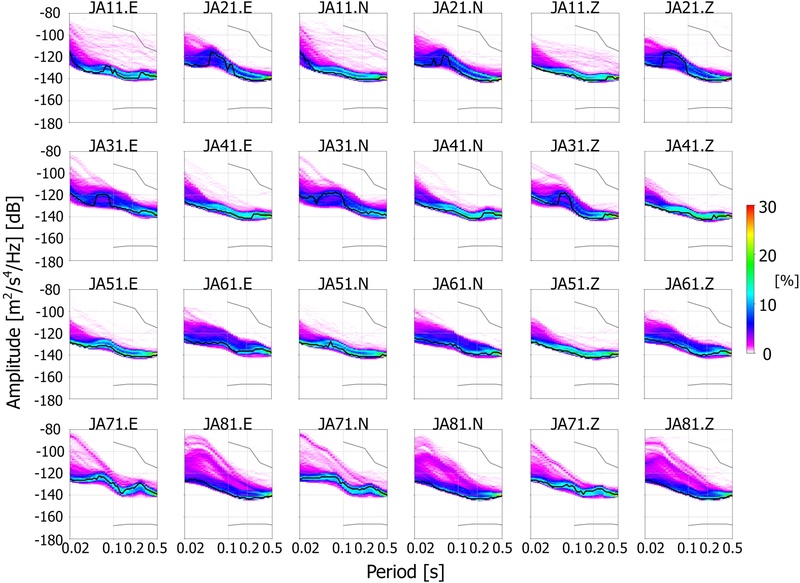
Probabilistic power spectral density (PPSD) plots for all temporary stations and components over the full deployment period. The color scale represents probability density (%). Gray curves show the New Low Noise Model (NLNM) and New High Noise Model (NHNM) of Peterson (1993), and black curves indicate the modal PSDs.
4.2. 지진 상대 규모 산정 결과
2023년 7월 29일부터 8월 23일까지 약 26일의 분석 기간 동안 임시지진관측망에 기록된 연속파형자료를 검토하여 총 153회의 지진을 수동으로 검출하였다. 이 과정에서 비자연적 잡음 신호, 연구 지역 외부에서 발생한 지진, 그리고 SNR이 낮거나 위상 식별이 어려운 지진은 제외하였으며, 최종적으로 총 131회의 지진을 분석에 사용하였다. 검출된 지진의 발생은 본진 이후 전반적으로 감소하는 경향을 보였으나, 8월 6일 오전 10시부터 약 11시간 동안 전체의 약 40%에 해당하는 60회의 지진이 집중적으로 발생하는 구간이 확인되었다. 이 중 4개소 이상의 관측소에서 파형이 명확하게 기록된 여진을 대상으로 상대 규모(Mrel)를 산정한 결과, Mrel -1.52에서 0.79 범위로 나타났다. 다수의 지진은 -1.3에서 -0.5 구간에 분포하였으며, Mrel 0 이상인 지진은 4건으로 산정되었다(그림 5).
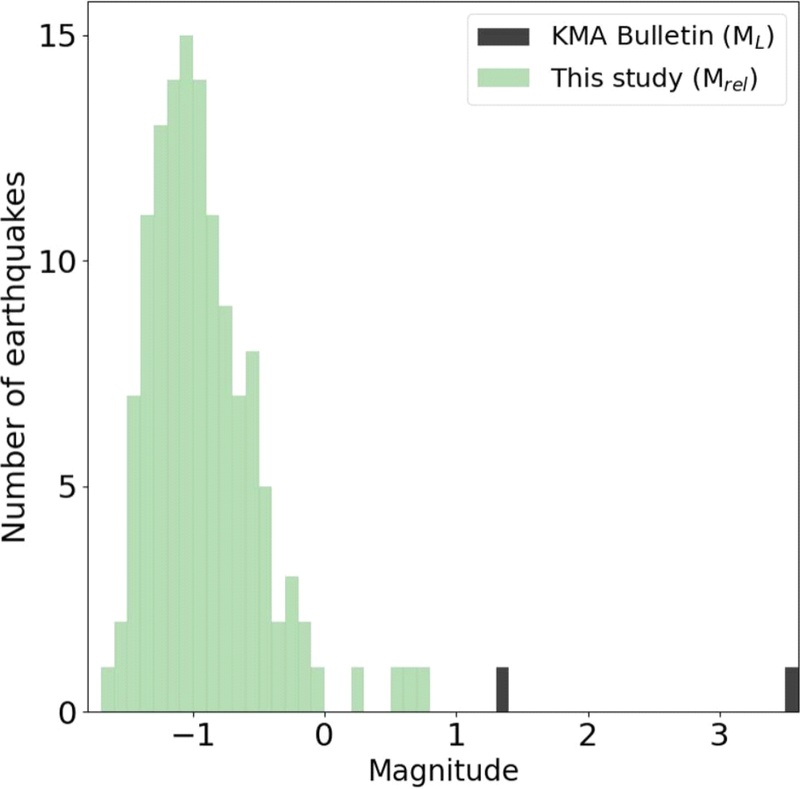
Frequency-magnitude distribution of earthquakes in the Korea Meteorological Administration catalog (black bars; 2 events) and events detected in this study (green bars; 129 events). The magnitudes for events detected in this study are relative magnitudes (Mrel).
4.3. 진원 위치 결정 결과 및 분포 양상
검출한 모든 지진 중 4개소 이상의 상시관측소 및 임시지진관측소에서 관측되는 131회의 지진에 대해 P파 도착 시간과 S파 도착 시간 각각 1190건, 1153건을 기반으로 HYPOELLIPSE를 사용하여 단일 진원 위치를 결정하였다. 이후 HypoDD를 사용하여 진원 위치를 재결정하였으며, 위치 재결정 과정에서 주변 다른 지진과의 연결 부족이나 역산 과정에서의 높은 불확실성 등으로 인해 31개의 지진이 제외되어 총 100개의 지진의 위치가 재결정되었다. HYPOELLIPSE를 사용한 초기 위치는 그림 6a에, HypoDD를 사용하여 재결정한 결과는 그림 6b에 제시하였다.
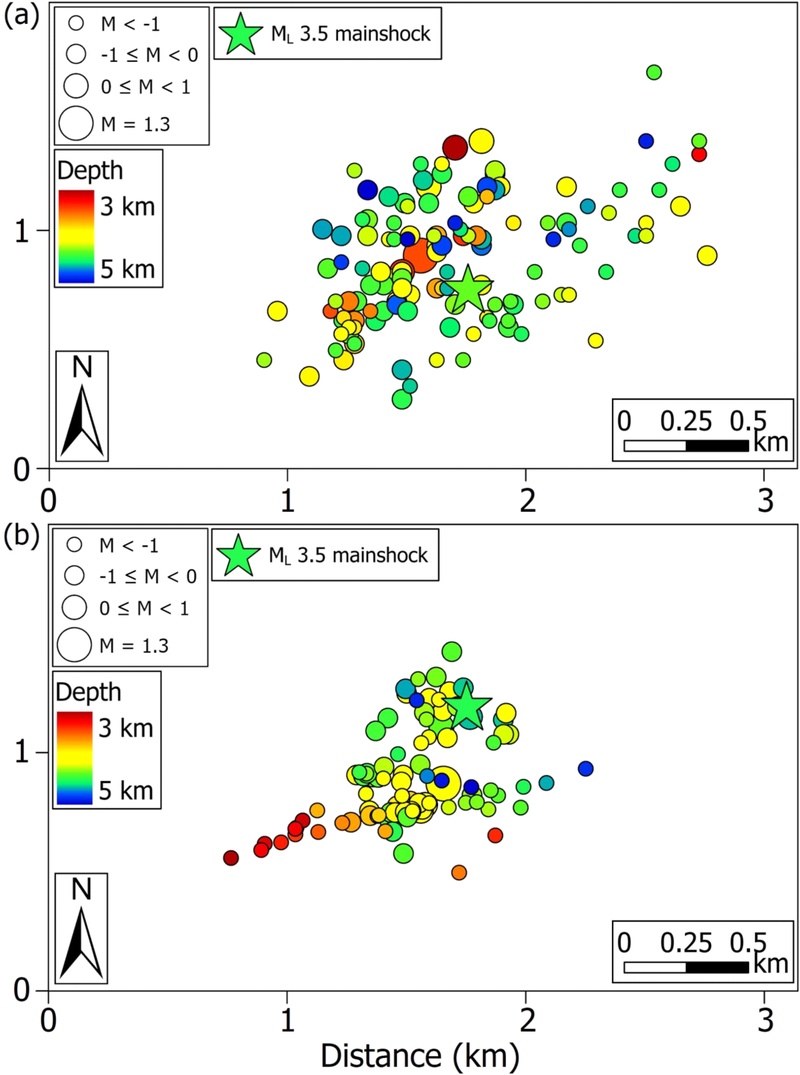
Hypocenter distributions obtained from (a) initial earthquake locations using HYPOELLIPSE and (b) double-difference relocations using HypoDD. The green star marks the 2023 ML 3.5 mainshock, and event colors indicate focal depth.
초기 위치 결정된 지진 분포만으로는 지진이 발생한 구조를 식별하기 어려우나, 위치 재결정된 결과에서는 지진 분포가 두 가지의 방향성을 따라 분리되는 경향이 확인되었다. 이러한 경향을 정량적으로 분리하기 위해, 본진과 대부분의 여진으로부터 가장 가까운 JA11 관측소에 기록된 수직 성분 파형을 이용하여 상관계수를 기반으로 계층적 군집 분석을 수행하였다. 파형의 상관계수가 0.7 이상인 지진들을 서로 군집화한 결과, 총 10개의 군집(G1 ~ G10)이 형성되었다(그림 7). 이를 위치 재결정된 지진 분포와 중첩한 결과, G1 군집은 약 0.5 km의 동북동-서남서 방향성의 지진 분포에, G1를 제외한 모든 군집(G2 ~ G10)들은 북북동–남남서 방향성의 지진 분포와 대응되는 것으로 나타났다(그림 8). 단면 A–A’와 B–B’는 G1 군집을 제외한 모든 군집과 본진의 분포를 보여주며, 이 군집의 지진은 약 4–5 km 깊이에 분포하였다(그림 8c). 단면 C–C’와 D–D’는 G1 군집과 여진 Mrel 0.64의 지진 분포를 나타내며, 대부분의 지진이 4 km 전후의 깊이에서 발생한 것으로 나타났다(그림 8e).
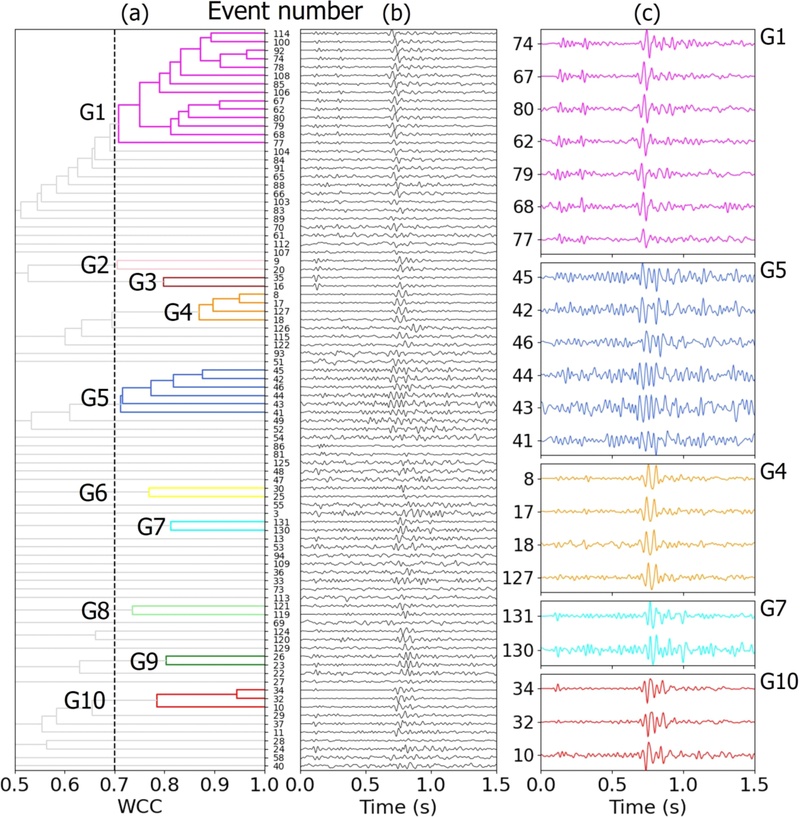
Hierarchical clustering of event waveforms. (a) Dendrogram constructed from vertical-component waveforms recorded at station JA11. Waveforms are normalized and bandpass filtered at 5–40 Hz. The vertical dashed line marks the cutoff waveform correlation coefficient (WCC ≥ 0.7) used to define clusters. (b) Waveforms ordered according to the dendrogram. (c) Example waveforms from selected clusters (G1, G5, G4, G7, and G10), with clusters distinguished by color.
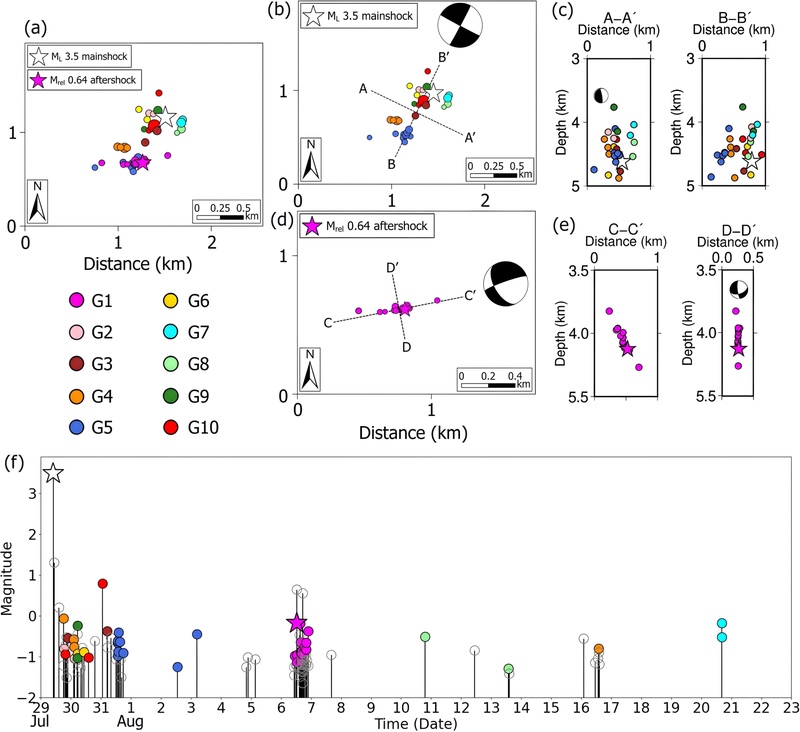
Relocated hypocenters classified by hierarchical clustering. Event colors correspond to the clusters shown in Fig. 7. (a) Map view of all clusters (G1–G10). (b) Map view of all clusters except G1, together with the focal mechanism of the ML 3.5 mainshock, and (c) corresponding cross-sections along A–A' and B–B'. (d) Map view of the G1 cluster and the focal mechanism of the Mrel 0.64 aftershock, and (e) corresponding cross-sections along C–C' and D–D'. (f) Time-magnitude distribution of the mainshock and relocated events.
시간에 따른 지진 군집 발생 순서를 살펴보면, 여진 활동은 본진 발생 직후 북북동-남남서 방향 구조의 북측에서 우선적으로 발생하며(G2, G3, G4, G6, G9, G10), 이후 남쪽으로 이동한 경향(G5)이 관측되었다(그림 8b, 8f). 이후 지진 분포의 가장 남쪽에 위치한 동북동-서남서 방향으로 분포한 군집(G1)이 8월 6일 하루 동안 집중적으로 분포하며(그림 8d, 8f), 이후 다시 북북동-남남서 방향의 구조를 따라 지진(G7, G8)이 발생하였다(그림 8b, 8f).
4.4. 단층면해
단층의 정확한 기하와 운동 감각을 보다 구체적으로 파악하기 위해, ML 3.5 본진과 2023년 8월 6일 12시 41분 33초(UTC; Coordinated Universal Time)에 발생한 Mrel 0.64 여진에 대해 단층면해를 결정하였다. ML 3.5 본진은 상시관측소만 사용되었으며, Mrel 0.64 여진의 단층면해 결정에는 상시관측소와 임시지진관측망 자료가 동시에 사용되었다. 분석 결과, ML 3.5 본진은 북북동-남남서 방향(주향 28°, 경사 88°, 면선각 178°) 혹은 북서-남동 방향(주향 117°, 경사 87°, 면선각 3°)의 주향이동단층 단층면해로, Mrel 0.64 여진은 동북동-서남서 방향(주향 247°, 경사 80°, 면선각 -132°) 혹은 북북서-남남동 방향(주향 146°, 경사 42°, 면선각 -14°)의 주향이동단층 운동이 우세하며 역단층성 성분이 일부 포함된 단층면해로 결정되었다(그림 8b, 8d).
5. 토 의
5.1. 산정된 상대 규모 특성 및 해석
장수지진의 본진 규모는 ML 3.5이며, 기상청 지진목록에서 확인되는 최대 여진은 ML 1.3이다. 이에 따른 본진–최대 여진 간 규모 차이는 2.2로, Båth의 경험적 관계가 제시하는 평균적인 규모 차이인 약 1.2보다 크게 나타났다(Båth, 1965). 최근 한반도에서 발생한 일부 지진 사례에서도 본진과 최대 여진 간 규모 차이가 큰 경우가 보고된 바 있다. 예를 들어 2023년 강화 해역지진에서는 본진 규모 ML 3.7과 최대 여진 규모 ML 1.2를 기준으로 약 2.5의 규모 차이가 나타났으며(KMA, 2023), 2024년 부안 지진에서는 약 1.7의 규모 차이가 제시된 바 있다(Han and Kim, 2025). 또한 장수지진의 경우 기상청 지진목록에 본진과 ML 1.3 여진 이후 추가 지진이 수록되지 않았다는 점은, 장수지진 이후 상시관측망에서 탐지 및 목록화될 정도의 비교적 큰 여진 활동이 두드러지지 않았음을 보여준다. 다만 이는 기상청 지진목록을 기준으로 한 해석이며, 본 연구에서 임시지진관측망을 통해 확인한 여진 활동과는 구분된다.
본 연구에서 검출된 지진의 상대 규모는 -1.52에서 0.79 범위에 분포하며, 다수의 지진이 음의 규모 영역에 집중되어 나타난다. 상대 규모가 0 이상인 지진은 4건에 불과하며, 이는 본진 이후의 여진 활동이 전반적으로 소규모에 국한되어 있었음을 시사한다. 더불어 일부 여진이 진앙으로부터 약 6 km 거리에 위치한 상시관측소 DGHA에서도 기록되지 않았다는 점은, 본 연구에서 검출된 여진이 매우 작은 규모임을 뒷받침한다(그림 9). 이러한 결과는 임시지진관측망이 진앙 인근에 밀집하여 설치되고 관측소 간 간격이 감소함에 따라, 기존 상시관측망에서 검출이 어려웠던 여진까지 포함된 것에 기인한 결과로 판단된다.
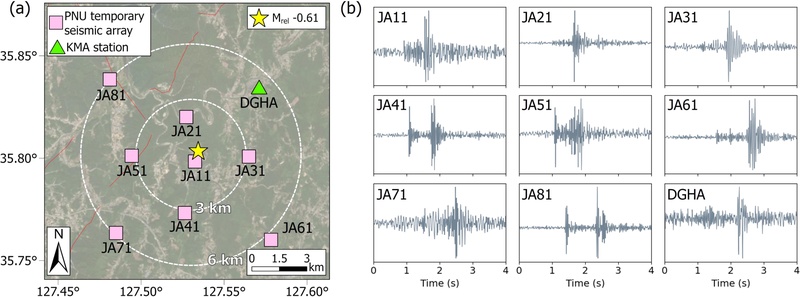
Locations of the temporary seismic array, the permanent KMA station DGHA, and an example aftershock. (a) The yellow circle marks an aftershock with Mrel = -0.61 that occurred on 31 July 2023 at 15:01:17.22. (b) Vertical-component waveforms of this event recorded at the temporary stations and DGHA. All waveforms are bandpass filtered at 5–40 Hz.
한편, 본 연구에서는 진폭–규모 스케일링 상수 c를 연구 지역 자료로부터 직접 추정하지 않고, 기존 상대 규모 산정 연구(Schaff and Richards, 2014; Shelly et al., 2016)에서 적용된 방법에 따라 c = 1을 가정하여 상대 규모를 산정하였다. 일반적으로 c의 경험적 추정을 위해서는 다양한 규모 범위를 포함하는 충분한 계기지진 자료가 요구된다. 그러나 본 연구 지역에서는 이러한 조건을 충족하는 자료의 확보가 제한적이며, 일부 여진은 상시관측소에 기록되지 않아 동일한 기준에서의 직접 비교에도 한계가 존재한다. 이에 따라 본 연구에서는 지역 규모식의 보정계수를 새롭게 추정하기보다는, 동일 관측소에서 측정된 진폭비를 기반으로 여진 간 상대적인 규모 차이를 비교하는 데 중점을 두었다.
5.2. 여진 분포와 기존 지질 구조와의 연계
장수지진 발생 구역에는 지진의 원인이 되는 단층으로 간주할 수 있는 구조가 현재까지 보고된 바 없으며, 해당 구역의 지표 단층에 대한 선행 연구도 제한적인 실정이다. 이로 인해 장수지진의 발생 원인을 기존 지질 구조에 근거하여 직관적으로 해석하는 데에는 한계가 있다. 그럼에도 불구하고, 본 연구에서 도출된 여진 분포와 단층면해 결과는 연구 지역의 광역적인 지질 구조 및 백악기 분지 충전물의 경계와 공간적으로 유사한 분포 특성을 나타낸다.
본진을 포함한 여진의 공간적인 분포는 연구 지역이 속한 옥천대에서 우세한 북동-남서 방향의 구조적 경향과 전반적으로 유사하다(Choi et al., 2012; Kang et al., 2012). 이러한 구조적 방향성은 본 연구에서 관측된 북북동-남남서 방향의 지진 분포와 ML 3.5 본진의 단층면해 결과에서도 공통적으로 확인된다. 또한, 연구 지역에는 서로 다른 연령과 물성을 갖는 암체들이 인접하여 분포하며, 일부 여진 군집은 이러한 암체 경계 인근에 위치하는 경향을 보인다(그림 10).
특히 진안분지의 충전물인 백악기 화산암(Krh)과 기반암인 선캄브리아시대 흑운모편마암(PCEbtgn)의 경계는 북동-남서 방향으로 발달해 있으며, 일부 여진 분포의 방향성과 유사한 경향을 보인다(KIGAM, 2020). 이러한 암종 경계는 물성 대비에 의해 구조적 약대(weak zone)를 형성할 가능성이 있으며(Sibson, 1985; Bedford et al., 2022), 본 연구에서 확인된 일부 여진 분포와 공간적으로 비교 가능한 특징을 보인다. 특히 재결정된 진원이 주로 3–5 km 깊이에 집중되어 비교적 얕게 분포한다는 점은, 지표에서 확인되는 암체 경계 또는 그 심부 연장이 여진 발생 구조와 관련될 가능성을 검토할 수 있게 한다. 다만 지표 지질 경계와 3–5 km 깊이의 활성 구조가 직접적으로 연결되는지를 판단하기 위해서는 고해상도 지질·지구물리 조사와 추가적인 지진학적 분석이 필요하다.
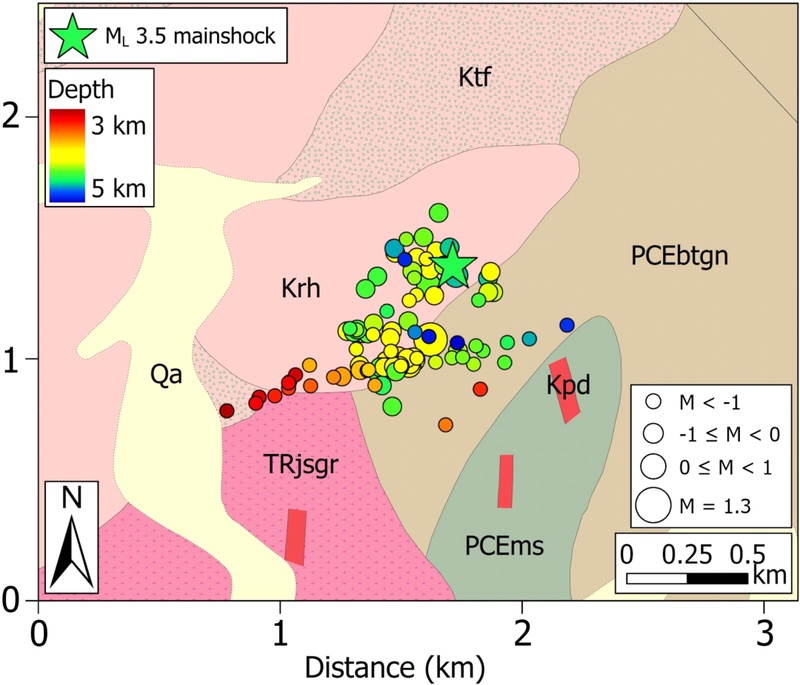
Geological map of the study area with relocated hypocenters. Colored circles indicate relocated hypocenters, with colors denoting focal depth. The green star marks the 2023 ML 3.5 Jangsu mainshock. Geological units are Precambrian biotite gneiss (PCEbtgn), Precambrian mica schist (PCEms), Triassic Jangsu granite (TRjsgr), Cretaceous rhyolite (Krh), Cretaceous tuff (Ktf), Cretaceous pegmatite vein (Kpd), and Quaternary alluvium (Qa).
한편, Mrel 0.64 여진의 단층면해 결과는 주향이동단층 운동이 우세하되 일부 역단층성 운동이 함께 나타나는 복합적인 운동 특성을 나타낸다. 아울러 단층면해의 주향은 깊이 3–5 km 아래의 G1 군집에 해당하는 동북동-서남서 여진 분포의 방향과도 전반적으로 정합적인 양상을 보인다. 이러한 특성은 해당 영역의 시대별 암상 분포와 지질구조의 국지적 기하 변화 또는 부차단층의 영향이 반영되었을 것으로 해석할 수 있다. 종합하면, 장수지진 여진 분포는 최소 두 개의 상이한 방향성을 갖는 구조를 따라 전개되며, 이는 본진과 Mrel 0.64 여진의 단층면해 결과와 함께 전반적으로 조화를 이룬다. 이러한 결과는 연구 지역의 여진 활동이 하나의 단층에서만 발생한 것이 아니라, 구조적으로 이질적인 두 단층 또는 분절된 단층계 내에서 발생했을 가능성을 시사한다.
5.3. 계층적 군집 분석을 통한 여진 활동의 시공간적 특성
위치 재결정된 지진과 계층적 군집 분석 결과로 확인된 여진의 분포는 장수지진의 여진 활동이 단일 단층면 내에서만 이루어진 것이 아닌 서로 다른 방향성을 갖는 구조를 따라 시공간적으로 분포하는 양상을 보인다(그림 8). 특히 여진 군집들은 시간에 따라 서로 다른 공간 영역에서 순차적으로 발생하는 경향을 나타내며, 일정 시간 간격을 두고 다른 구조로 이동하는 형태를 보였음을 의미한다. 북북동남남서 방향에 해당하는 일부 군집(G7, G8)은 다른 군집에 비해 비교적 늦은 시기에 발생하였고, 공간적으로도 다소 이격된 분포를 보인다. 이러한 분포 특성은 해당 단층대 내부에 복수의 구조적 분절이 존재하는 것으로 해석할 수도 있으나, 해당 군집에 포함된 지진 수가 제한적이어서 이를 정량적으로 검증하기에는 한계가 있다.
한편, G1 및 G5 군집의 경우 짧은 시간 내에 다수의 지진이 집중적으로 발생한 후 소산되는 양상을 보이며, 군집 간 발생 시점이 시공간적으로 순차적인 특징을 나타낸다. 이러한 관측 결과는 여진 활동이 단층 간 상호작용에 의해 순차적으로 전파되었을 가능성을 시사하나, 본 연구에서는 단층 간 응력 전달(stress transfer)로 인한 seismic roaming이나 cascading 현상, 또는 Coulomb Failure Stress (CFS) 변화와 같은 물리적 메커니즘은 본 자료만으로 정량적인 방법으로 규명하기에는 한계가 존재한다. 따라서 본 연구에서는 군집 간의 시공간적 전이를 관측적인 특징으로 제시하는 데 중점을 두었으며, 물리적인 현상에 대한 보다 정량적인 해석은 향후 추가적으로 검토될 필요가 있다.
6. 결 론
본 연구에서는 2023년에 발생한 규모 3.5 장수지진의 여진 활동을 대상으로 상시관측망 자료와 임시지진관측망 자료를 활용하여 여진 분포 특성과 단층의 구조 및 운동학적 특성을 분석하였다. 약 26일 동안 총 153회의 지진을 검출하였으며, 이 중 131회에 대해 초기 진원 위치를 결정하고, 최종적으로 100회의 지진에 대해 이중차분법을 적용하여 위치를 재결정하였다. 위치 재결정된 지진은 주로 3–5 km 깊이에서 발생하였으며, 북북동-남남서 및 동북동-서남서 방향의 두 선형 배열을 보였다. 이러한 방향성은 본진 및 Mrel 0.64 여진의 단층면해에서 나타나는 주향과 대체로 일치한다. 따라서 장수지진의 여진 활동은 단일 방향의 단층면에만 국한되기보다, 서로 다른 방향성을 갖는 인접 단층 분절 또는 복합 단층계 내에서 발생했을 가능성이 있다. 또한 본진을 포함한 여진의 공간 분포는 옥천대의 구조적 방향성과 유사한 경향을 보이며, 일부 여진은 서로 다른 지질 경계 인근에 위치하여 지질학적 이질성과 공간적으로 연관되어 있을 가능성을 보였다. 계층적 군집 분석 결과, 여진들은 파형의 유사성에 따라 여러 군집으로 구분되었으며, 시간에 따라 서로 다른 단층 구조를 따라 이동하며 발생하는 양상을 보였다. 이는 장수지진 이후의 여진 활동이 인접한 구조들 사이에서 시공간적으로 변화하며 전개되었음을 시사한다. 산정된 지진의 상대 규모는 대부분 Mrel 0 미만으로 나타났으며, 이는 상시관측망 자료만으로는 검출이 어려운 소규모 여진 활동까지 포함하여 지진 분포를 보다 정밀하게 분석할 수 있음을 보여준다. 종합하면, 본 연구는 임시지진관측망 자료를 기반으로 장수지진의 여진이 서로 다른 방향성을 갖는 두 구조를 따라 시공간적으로 전개되었음을 확인하고, 여진 분포와 단층면해 결과를 종합하여 해당 지역의 지하 단층 구조를 제약하였다. 이는 향후 임시지진관측망 자료를 활용한 한반도 내륙 중소규모 지진의 여진 분석, 지하 단층 구조 해석, 그리고 지진 발생 특성 이해를 위한 기초 자료로 활용될 수 있다.
Acknowledgments
이 연구는 한국기상산업기술원의 강원 내륙 및 동해 중부해역 지하 단층구조 분석사업(RS-2022-KM220610)의 지원으로 수행되었습니다. 논문 심사과정에서 도움을 주신 심사위원님, 편집위원님, 그리고 편집위원장님께 깊은 감사를 드립니다.
References
-
Båth, M., 1965, Lateral inhomogeneities of the upper mantle. Tectonophysics, 2, 483-514.
[https://doi.org/10.1016/0040-1951(65)90003-X]

-
Bedford, J.D., Faulkner, D.R. and Lapusta, N., 2022, Fault rock heterogeneity can produce fault weakness and reduce fault stability. Nature Communications, 13, 326.
[https://doi.org/10.1038/s41467-022-27998-2]
-
Bunaga, I.G.K.S., Rosid, M.S., Anggono, T. and Septiadhi, A., 2023, Determination of 1-D Seismic Velocity Model in Lombok Island. Jurnal Penelitian Pendidikan IPA, 9, 10663-10670.
[https://doi.org/10.29303/jppipa.v9i11.6023]
-
Choi, D.K., Woo, J. and Park, T.Y., 2012, The Okcheon Supergroup in the Lake Chungju area, Korea: Neoproterozoic volcanic and glaciogenic sedimentary successions in a rift basin. Geosciences Journal, 16, 229-252.
[https://doi.org/10.1007/s12303-012-0031-6]
-
Chough, S.K., Kwon, S.-T., Ree, J.-H. and Choi, D.K., 2000, Tectonic and sedimentary evolution of the Korean Peninsula: A review and new view. Earth-Science Reviews, 52, 175-235.
[https://doi.org/10.1016/S0012-8252(00)00029-5]
-
Cluzel, D., Jolivet, L. and Cadet, J.P., 1991, Early middle Paleozoic intraplate orogeny in the Ogcheon belt (South Korea): a new insight on the Paleozoic buildup of East Asia. Tectonics, 10, 1130-1151.
[https://doi.org/10.1029/91TC00866]
-
Gable, S.L. and Huang, Y., 2025, Quantifying magnitude uncertainty of the 2019 Ridgecrest earthquake sequence through a sensitivity study of the relative magnitude method. Bulletin of the Seismological Society of America, 115, 1294-1307.
[https://doi.org/10.1785/0120240126]
- Geiger, L., 1910, Herdbestimmung bei Erdbeben aus den Ankunftszeiten. Nachrichten von der Gesellschaft der Wissenschaften zu Göttingen. Mathematisch-Physikalische Klasse, 331-349.
- Geiger, L., 1912, Probability method for the determination of earthquake epicenters from arrival time only. Bulletin of St. Louis University, 8, 60-71.
-
Given, H.K., 1990, Variations in broadband seismic noise at IRIS/IDA stations in the USSR with implications for event detection. Bulletin of the Seismological Society of America, 80, 2072-2088.
[https://doi.org/10.1785/BSSA08006B2072]
-
Han, J. and Kim, S., 2025, The 2024 ML 4.8 Buan earthquake sequence and aligned multiple clusters in the southwestern Korean Peninsula. Geosciences Journal, 29, 727-741
[https://doi.org/10.1007/s12303-025-00048-x]
-
Hardebeck, J.L. and Shearer, P.M., 2002, A new method for determining first-motion focal mechanisms. Bulletin of the Seismological Society of America, 92, 2264-2276.
[https://doi.org/10.1785/0120010200]
-
Johnston, A.C., 1996, Seismic moment assessment of earthquakes in stable continental regions-I. Instrumental seismicity. Geophysical Journal International, 124, 381-414.
[https://doi.org/10.1111/j.1365-246X.1996.tb07028.x]
-
Kang, J.-H., Hayasaka, Y. and Ryu, C.-R., 2012, Tectonic evolution of the Central Ogcheon Belt, Korea. Journal of Petrological Society of Korea, 21, 129-150 (in Korean with English abstract).
[https://doi.org/10.7854/JPSK.2012.21.2.129]
-
Kennett, B.L.N. and Engdahl, E.R., 1991, Traveltimes for global earthquake location and phase identification. Geophysical Journal International, 105, 429-465.
[https://doi.org/10.1111/j.1365-246X.1991.tb06724.x]
-
Kim, H.S., Ree, J.H. and Yi, K. 2018a, The tectonic boundary between the Okcheon and Taebaeksan basins, South Korea: A restraining bend of a continental transform fault between the South and North China Cratons. Island Arc, 27, e12237.
[https://doi.org/10.1111/iar.12237]
-
Kim, K.-H., Kim, J., Han, M., Kang, S.Y., Son, M., Kang, T.S., Rhie, J., Kim, Y.-H., Park, Y., Kim, H.-J., You, Q. and Hao, T., 2018b, Deep fault plane revealed by high-precision locations of early aftershocks following the 12 September 2016 ML 5.8 Gyeongju, Korea earthquake. Bulletin of the Seismological Society of America, 108, 517-523.
[https://doi.org/10.1785/0120170104]
-
Kim, K.-H. and Park, Y., 2010, The 20 January 2007 ML 4.8 Odaesan earthquake and its implications for regional tectonics in Korea. Bulletin of the Seismological Society of America, 100, 1395-1405.
[https://doi.org/10.1785/0120090234]
-
Kim, K.-H., Seo, W., Han, J., Kwon, J., Kang, S.Y., Ree, J.H., Kim, S. and Liu, K., 2020, The 2017 ML 5.4 Pohang earthquake sequence, Korea, recorded by a dense seismic network. Tectonophysics, 774, 228306.
[https://doi.org/10.1016/j.tecto.2019.228306]
-
Kim, S.G., 2019, Analysis of recent seismic activity in the Korean Peninsula using the ETAS model. Journal of the Geological Society of Korea, 55, 105-115 (in Korean with English abstract).
[https://doi.org/10.14770/jgsk.2019.55.1.105]
-
Kim, W.-Y., Seo, M.S., Park, J.Y., Han, S., Son, Y.O. and Kim, Y., 2023, The 28 October 2022 Mw 3.8 Goesan earthquake sequence in central Korea: Stress drop, aftershock triggering, and fault interaction. Bulletin of the Seismological Society of America, 113, 2416-2431.
[https://doi.org/10.1785/0120230078]
- Korea Institute of Geoscience and Mineral Resources (KIGAM), 2020, Geological map of Korea. Available at https://data.kigam.re.kr/mgeo, (September 11, 2024).
- Korea Meteorological Administration (KMA), 2012, Historical earthquake records in Korea (2-1904). Report No. 11-1360395-000267-01, Seoul, South Korea.
- Korea Meteorological Administration (KMA), 2023, Seismological annual report. Korea Meteorological Administration, Seoul, Korea.
- Korea Meteorological Administration (KMA), 2025, Earthquake catalog. Available at https://necis.kma.go.kr/, (November 26, 2025).
-
Krischer, L., Megies, T., Barsch, R., Beyreuther, M., Lecocq, T., Caudron, C. and Wassermann, J., 2015, ObsPy: A bridge for seismology into the scientific Python ecosystem. Computational Science & Discovery, 8, 014003.
[https://doi.org/10.1088/1749-4699/8/1/014003]
-
Lahr, J.C., 1999, HYPOELLIPSE: A computer program for determining local earthquake hypocentral parameters, magnitude, and first-motion pattern (Y2K compliant version). U.S. Geological Survey, Open-File Report 99-23.
[https://doi.org/10.3133/ofr9923]
-
Lee, E.J., Kim, K.-H., Kang, S.Y. and Sohn, Y., 2025, Improved monitoring of the 2022 Goesan earthquake sequence using a temporary seismic array. Journal of the Geological Society of Korea, 61, 407-422 (in Korean with English abstract).
[https://doi.org/10.14770/jgsk.2025.015]
-
Lee, K. and Yang, W.-S., 2006, Historical seismicity of Korea. Bulletin of the Seismological Society of America, 96, 846-855.
[https://doi.org/10.1785/0120050050]
-
Lim, H., Cho, C.S. and Son, M., 2024, The 2022 Goesan earthquake of moment magnitude 3.8 along the buried fault in the central Korean Peninsula. Journal of Seismology, 28, 519-534.
[https://doi.org/10.1007/s10950-024-10201-y]
-
Liu, M., Li, L., Zhang, M., Lei, X., Nedimović, M.R., Plourde, A.P., Guo, R., Wang, W. and Li, H., 2023, Complexity of initiation and evolution of the 2013 Yunlong earthquake swarm. Earth and Planetary Science Letters, 612, 118168.
[https://doi.org/10.1016/j.epsl.2023.118168]
-
McNamara, D.E. and Buland, R.P., 2004, Ambient noise levels in the continental United States. Bulletin of the Seismological Society of America, 94, 1517-1527.
[https://doi.org/10.1785/012003001]
- Ministry of the Interior and Safety (MOIS), 2023, Report on the response to the earthquake in Jangsu, Jeollabuk-do on July 29. Ministry of the Interior and Safety, Seoul, Korea (in Korean).
- Park, J.-H., 2008, Crustal velocity structure of the Southern Korean Peninsula using 3-D seismic tomography. Ph.D. thesis, Seoul National University, Seoul.
- PASSCAL, 2017, PQL II—Program for viewing data. Available at https://www.passcal.nmt.edu/content/pqlii-program-viewing-data, (May 20, 2024).
-
Peterson, J., 1993, Observations and modeling of seismic background noise. U.S. Geological Survey, Open-File Report 93-322.
[https://doi.org/10.3133/ofr93322]
-
Schaff, D.P. and Richards, P.G., 2014, Improvements in magnitude precision, using the statistics of relative amplitudes measured by cross correlation. Geophysical Journal International, 197, 335-350.
[https://doi.org/10.1093/gji/ggt433]
-
Schulte, S.M. and Mooney, W.D., 2005, An updated global earthquake catalogue for stable continental regions: reassessing the correlation with ancient rifts. Geophysical Journal International, 161, 707-721.
[https://doi.org/10.1111/j.1365-246X.2005.02554.x]
-
Sheen, D.H. and Shin, J.S., 2010, Earthquake detection thresholds of broadband seismic networks in South Korea considering background seismic noise levels. Journal of the Geological Society of Korea, 46, 31-38 (in Korean with English abstract).
[https://doi.org/10.14770/jgsk.2010.46.1.31]
-
Shelly, D.R., Ellsworth, W.L. and Hill, D.P., 2016, Fluid-faulting evolution in high definition: Connecting fault structure and frequency-magnitude variations during the 2014 Long Valley Caldera, California, earthquake swarm. Journal of Geophysical Research: Solid Earth, 121, 1776-1795.
[https://doi.org/10.1002/2015JB012719]
-
Sibson, R.H., 1985, A note on fault reactivation. Journal of Structural Geology, 7, 751-754.
[https://doi.org/10.1016/0191-8141(85)90150-6]
- SmartSolo, 2022, SmartSolo sensor system. Available at https://smartsolo.com/cp-3.html, (March 6, 2025).
-
Son, M., Cho, C.S., Shin, J.S., Rhee, H.M. and Sheen, D.H., 2018, Spatiotemporal distribution of events during the first three months of the 2016 Gyeongju, Korea, earthquake sequence. Bulletin of the Seismological Society of America, 108, 210-217.
[https://doi.org/10.1785/0120170107]
- Trnkoczy, A., Bormann, P., Hanka, W., Holcomb, L.G., Nigbor, R.L., Shinohara, M. and Suyehiro, K., 2012, Site selection, preparation and installation of seismic stations. in New Manual of Seismological Observatory Practice 2 (NMSOP-2), Deutsches GeoForschungsZentrum GFZ, 1-139.
-
Waldhauser, F. and Ellsworth, W.L., 2000, A double-difference earthquake location algorithm: Method and application to the northern Hayward fault, California. Bulletin of the Seismological Society of America, 90, 1353-1368.
[https://doi.org/10.1785/0120000006]
-
Withers, M., Aster, R., Young, C., Beiriger, J., Harris, M., Moore, S. and Trujillo, J., 1998, A comparison of select trigger algorithms for automated global seismic phase and event detection. Bulletin of the Seismological Society of America, 88, 95-106.
[https://doi.org/10.1785/BSSA0880010095]
-
Woo, J.-U., Rhie, J. and Kang, T.-S., 2016, Performance test of hypocenter determination methods under the assumption of inaccurate velocity models: A case of surface microseismic monitoring. Geophysics and Geophysical Exploration, 19, 1-10 (in Korean with English abstract).
[https://doi.org/10.7582/GGE.2016.19.1.001]
-
Yin, A. and Nie, S., 1993, An indentation model for the North and South China collision and development of the Tan-Lu and Honam fault systems, eastern Asia. Tectonics, 12, 801-813.
[https://doi.org/10.1029/93TC00313]
-
Zulfakriza, Z., Nugraha, A.D., Heryandoko, N., Ry, R.V., Muttaqy, F., Andika, A. Azhari, M.F., Putra, A.S., Palgunadi, K.H., Cummins, P.R., Supendi, P., Lesmana, A., Sahara, D.P. and Puspito, N.T., 2024, Seismic source analysis of the destructive earthquake of November 21, 2022, Mw 5.6 Cianjur (Indonesia) from relocated aftershocks. Scientific Reports, 14, 12142.
[https://doi.org/10.1038/s41598-024-60408-9]